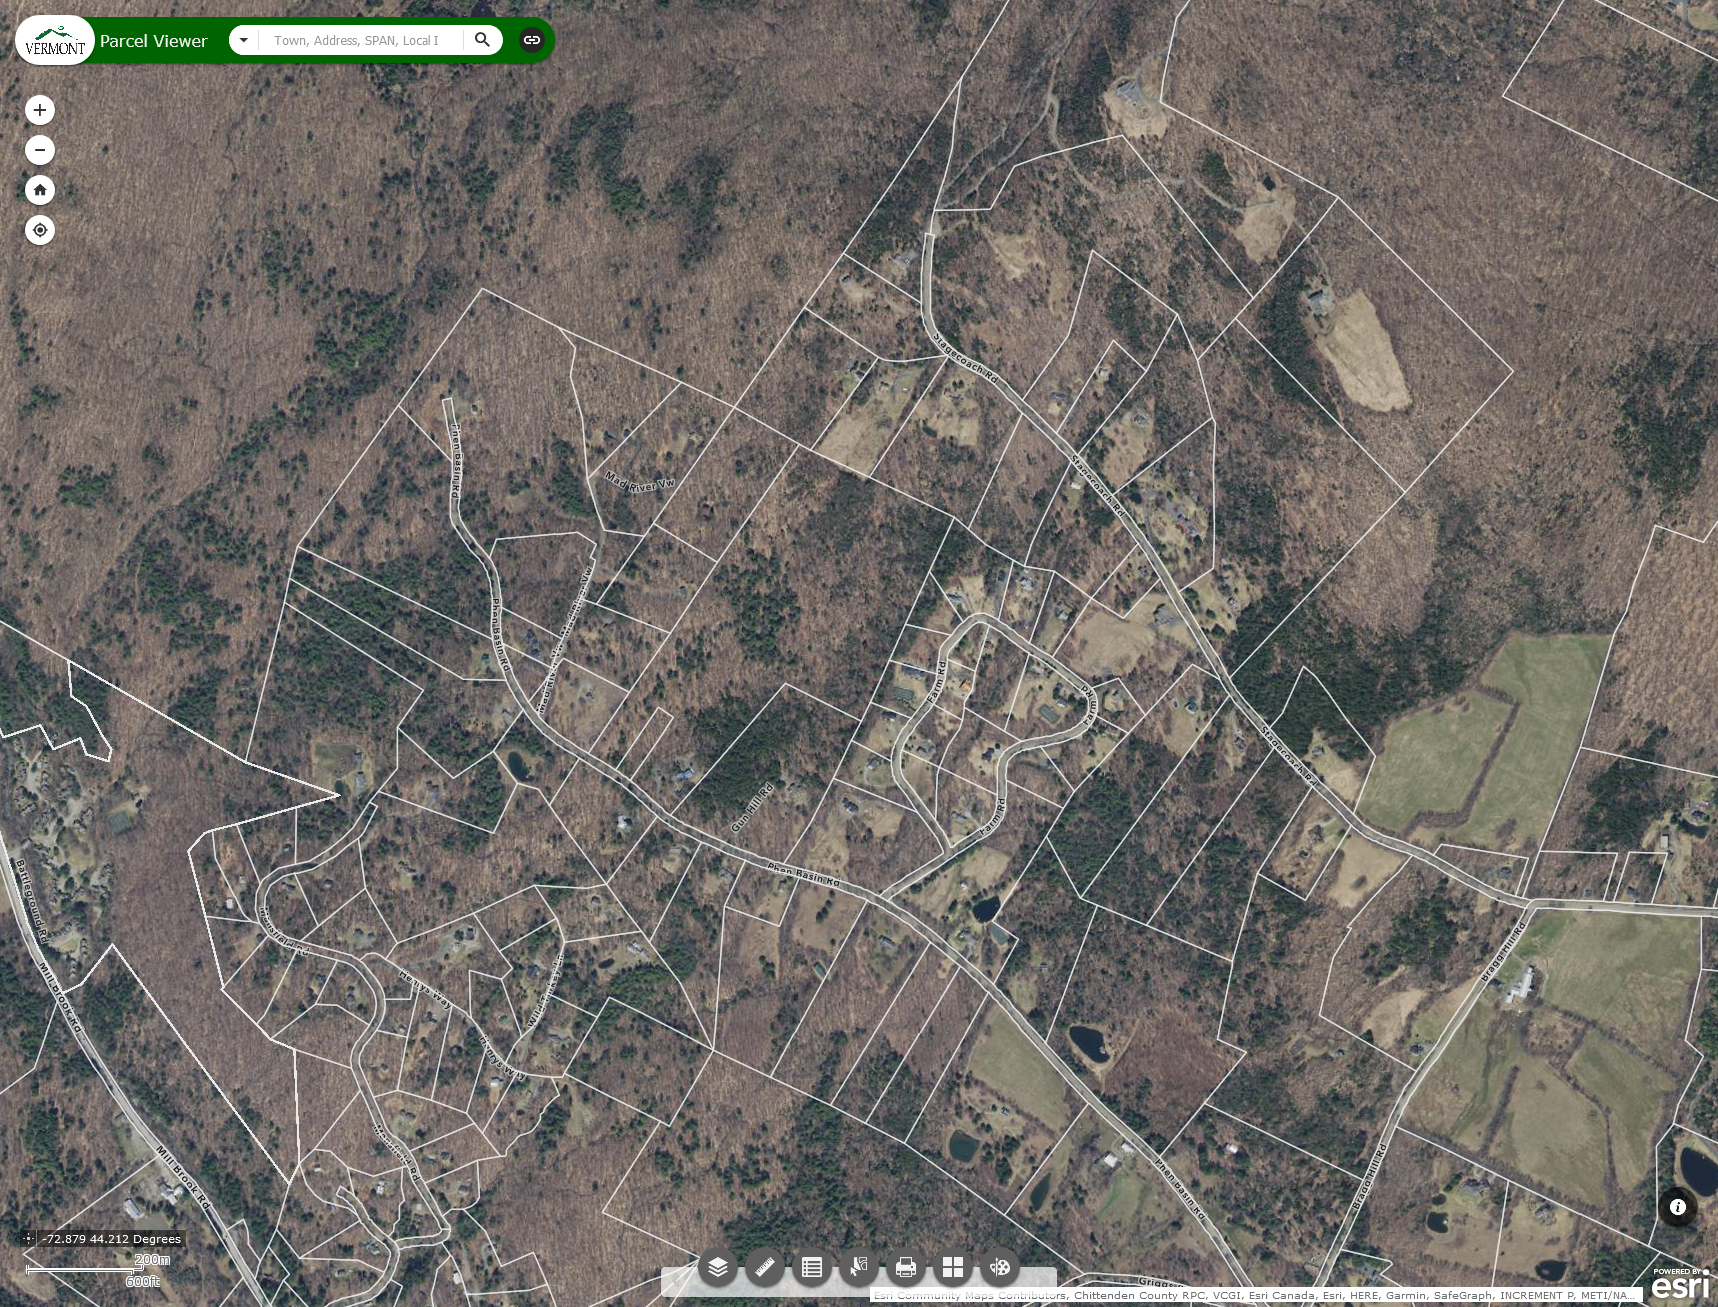
Vermont Parcel Viewer
Vermont’s land records are rooted firmly in in the 19th Century. With a population of less than 700,000 people, we have 251 municipalities that manage their own land records. Even Texas, with a population of over 29 million, only has 254 counties. Historically, there has been no consolidated public information available on property ownership. While most towns maintain some level of parcel tax maps, many of these are updated infrequently and often are based on paper maps. Prior to 2020, some towns had parcel maps that were from the 1990s.
On January 1, 2020 the State of Vemont completed a 3 year, $3 million project to map all of the parcels in Vermont. This data is linked to the annual state ‘grand list’ of property valuations and ownership. This data is made freely available, providing the first comprehensive picture of Vermont land ownership avaialble since the Beers Atlases were made in the 1880’s.
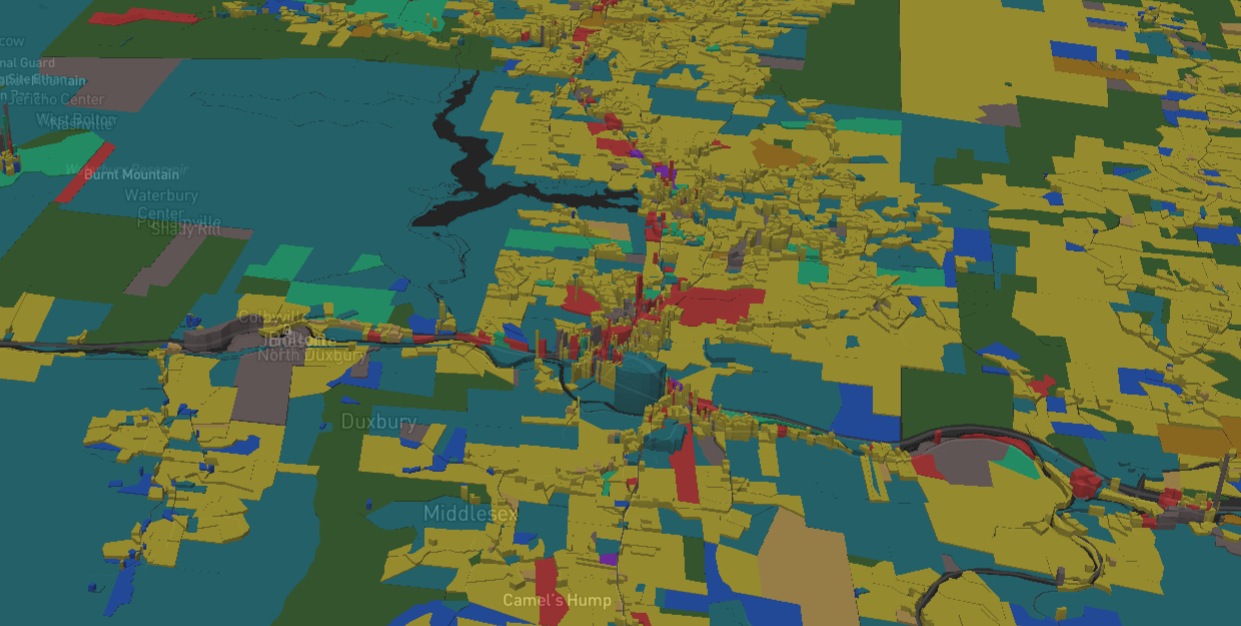
Vermont property values
Parcel ownership by land use category and value.
Property valuation in Vermont is the complied initialy at the town level. Towns are supposed to reappraise propety at least every ten years, but this tends to get stretched out. The state annually adjusts property values to a common level of appraisal for calculation of schools funding. This map shows Vermont property values per acre adjusted to the common level of appraisal (height) and land uses categories (color). You can clearly see the elevated value per acre of commercial - in red- and residential properties - yellow - in village areas and along road cooridors. Ponds and waterfront property show islands of elevated value in rural areas - often in blue indicating seasonal or second home ownership. Ski resorts also show up as pockets of extreme values scattered across the state.
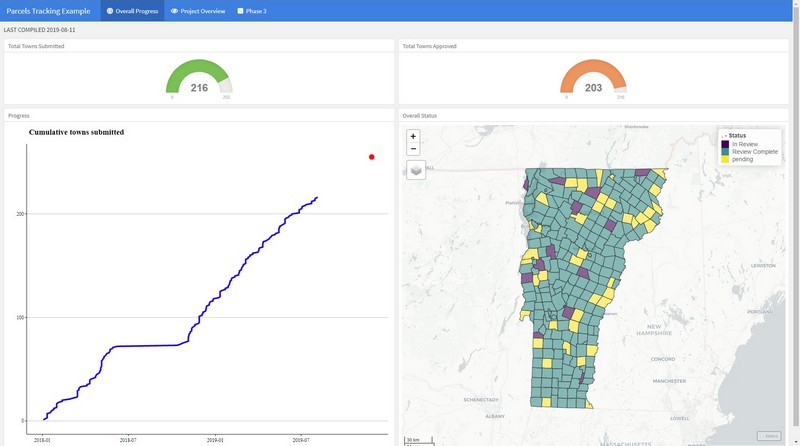
Project management flexboard
A {flexdashboard} for project tracking.
This is an example of an interactive project management dashboard built in R to track vendor data submissions and approvals by different state agencies and town officials during the project to build our statewide parcel data. This application pulled data from an ArcGIS Online data source on a daily basis and compiled up-to-date charts and maps. This kind of application could just as easily pull data from a database or multiple sources.
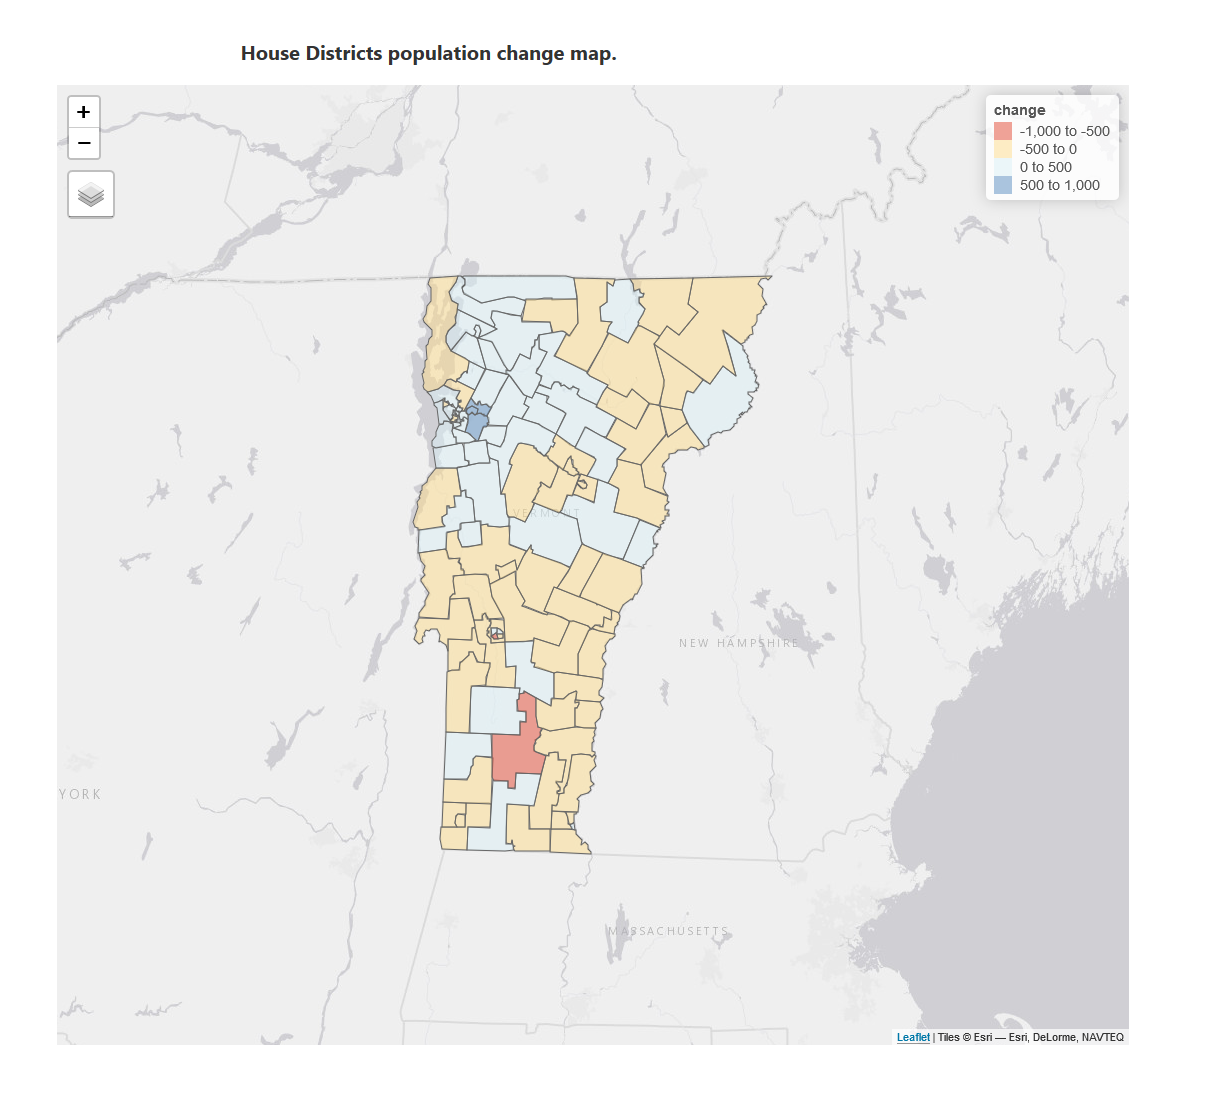
Legeslative Population Report
Rmarkdown for excels at professional, interactive reporting.
Geography and data visualization are fields where is it quite easy to confuse rather than inform. Our tools are so sophisticated that is easy to add too much to a simple message. It is also important to understand one’s audience. When responding to a request from the attorneys who adivise the Vermont Legislature and guide important policy like redistricting of State House and Senate Districts, one does not want to create a flashy report with lots of data vis or stunning maps, nor do they want to see your code chunks. Providing only a map or a graph is not likely to speak the right “dialect” of analysis. Rmarkdown excels at this kind of reporting - where charts, maps, tables, and narriative text all play an equaly an important role. This report details the current state of change in Vermont populations in advance of Census 2020. While unlikely to impress the #TidyTuesay Twitter crowd, this minimilistic report recieved a favorable response from its intended audience.